--Coach Client (CS:GO)--
#userinterface
I have spent some time deciding on the type of data I want to focus on showing in this coach client in order to allow coaches to have effective decision making. The goal here is to give the coaches enough information to base decisions off of. I have picked four areas where I want to focus on:
1.Weapon accuracy at adjustable ranges
2.Effective save rounds
3.Effective bomb plant positions
4.Defuse kit stat dampening
Along with this information, I want to create a general filter of options that the coach would be able to toggle that would apply over the top of all data presented by the client. The idea is that at any time, whether it be during a live match, or offline going over a replay, the coach can change some data filtering options to directly alter the way information is being presented. The options the coach would have would be things such as comparing data against different teams (as well as their own), different maps, and all along with a timeline to be able to identify the data relevant to the coach at the current time. The idea behind this is that if the team changes or a map changes, the coach can select currently relevant data, then looking at a global data set, which would be unhelpful in most cases. In summary, the global filter options I want to have in the client are as follows:
1.Team comparison
2.Date comparison
3.Map comparison
Here is a basic mockup of the client, and gets the main idea across of what I want to immediately expose to the user. The core idea here is that the coach can see the current standing of the match, the teams that are playing, as well as the players. The bar on the left is where the coach can add players to compare against each other, or to see their stats individually. A player from any team can be added here, and their current team (if they are playing currently) is marked with either a “T” or a “CT” within the <> after their name. I have tried to keep most of the current match information close to the top of the screen in one place so the coach would not have trouble in the middle of the game seeing the current stats while being able to still look at players’ individual stats. This is still a very basic mockup and does not include any of the interesting information I want to display to the coach.
Weapon Accuracy at Adjustable Ranges
This feature of the client is responsible for allowing the coach to look over both the effective and ineffective weapon usage of any player. The idea behind this is that a player may have a bias toward a certain weapon due to past experiences, however, in the current match they could be doing worse with the weapon than normal, and may be way more effective with another weapon. For example, a player could be using the Galil for the early section of the game, and switch to the AK-47 for the middle section, and does considerable worse in terms of weapon effectiveness. Using the information displayed, the coach will be able to see the effectiveness of both and could advise the player to use the Galil instead, and save money.
I want to have a few filtering options for this feature specifically to allow the coach to display certain weapon types (as well as specific weapons within that type), and identify a spread at a specific range. I want to have the specified range because I want to rule out where players are simply shooting at far away targets because they are caught in a bad spot. I want to limit the range to the weapon’s effective range to give the player a fair rating, and so the data is more usable.
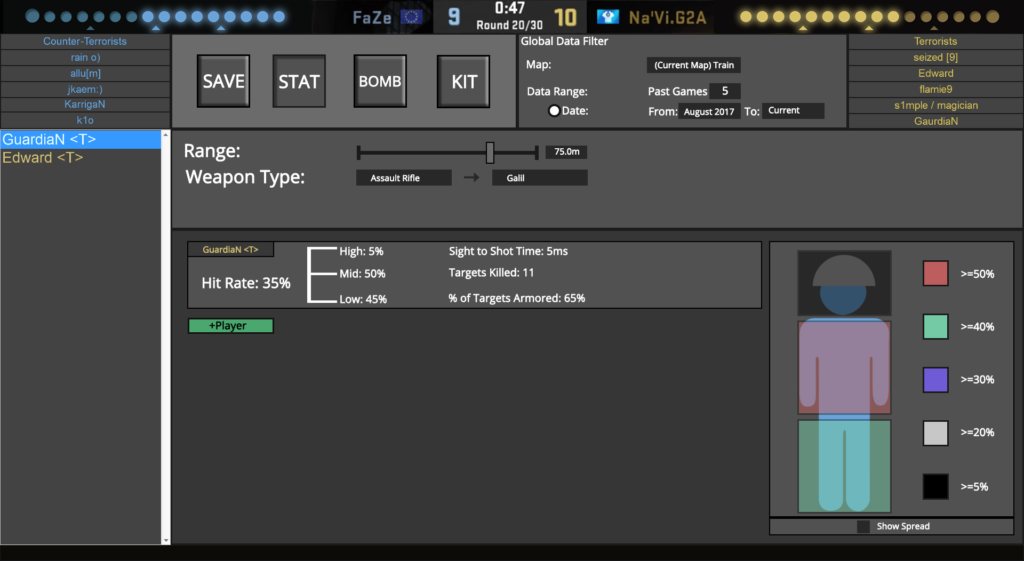
Pictured below is a mockup of how I would want the feature to look like:

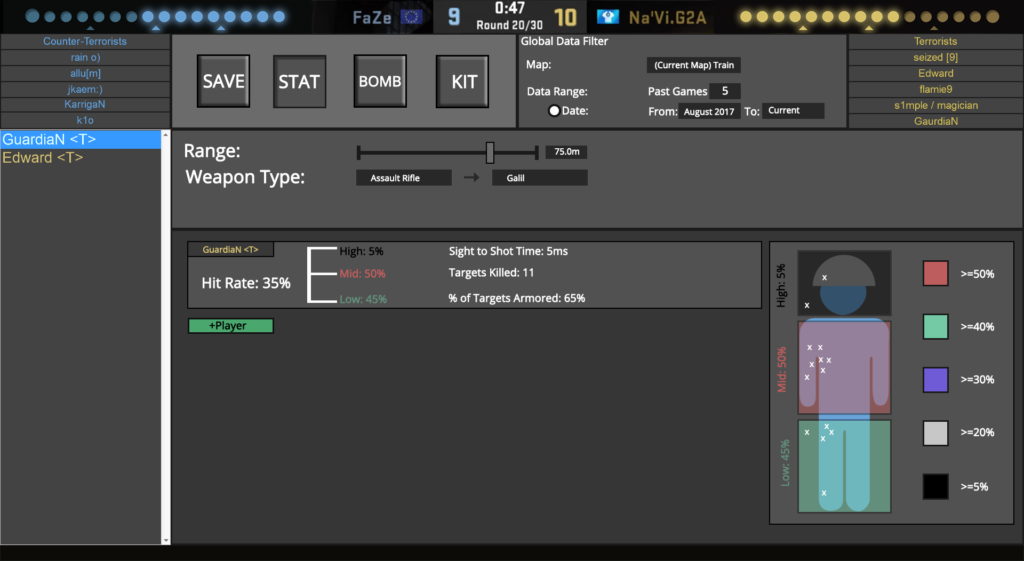
Here is the basic idea of the feature, highlighting the weapon filter directly under the global data filter. Here the coach can use the slider to determine the range and select the weapon type and optional specific weapon. Pictured below is a cropped image showing off the feature more:
Here the coach can add a new player to the window to be able to see their accuracies. The idea is that this new player can be from any team, on any side, and not even in the current game if one is being played. This feature can be used for both LAN as well as looking over replays while practicing. Next, the coach can see the player’s hit rate, along with a basic breakdown of their shots, and where they hit the target. Next to this, I have a few basic stats such as how many targets were killed, along with how many of the targets hit were armored. The idea of this is that the coach will be able to determine if the player should be buying higher armor penetration weapons instead. Finally, I have a stat that displays their sight to shot time in milliseconds. The idea behind this is that the coach can determine the player’s reaction speed comparatively to the player’s hit rate. If a player is able to start shooting faster, than they have a leg up in the duel.
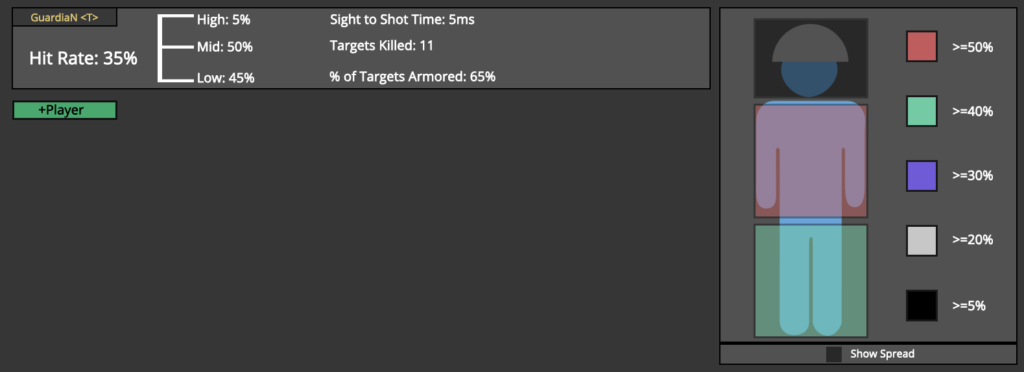
Looking to the right of this window, there is an image of a solider, with a more detailed breakdown of the shots that have been hit, using colors as a marking for how much hit where. The biggest feature of this window is the “show spread” tick box at the bottom which highlights the player’s weapon spread. Here it is pictured below:
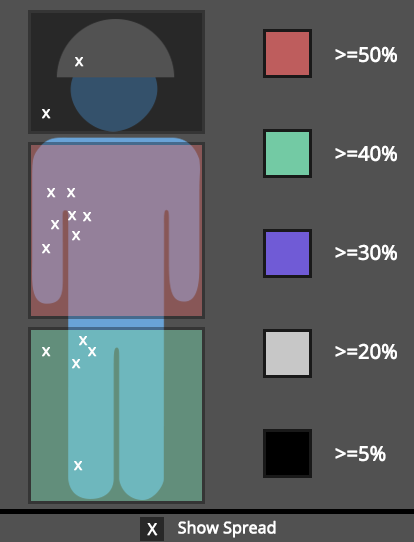
With the weapon spread shown, it is easy to see that the player is shooting far to the left, and has a significant number of missed shots because of this. This is information that the coach could relay to the player to correct the shots.
After receiving some feedback from this screen, I realized that there is almost no reason to look at the soldier spread screen without seeing the spread. Without the spread, the information is basically a more complex and hard to read the shot breakdown. I have removed the option of seeing the spread, to always show it. Another change that I did was to add the breakdown next to the colored blocks, as well as color code the text to the hit percentage to the colors of the soldier screen breakdown.
Effective Save Rounds
The idea behind this is that the client will show the coach at which rounds in the game the team he is coaching have saved and if rounds after were won. In other words, I want to show the coach that if saving in this round right now, has this been successful in the past on this map. Now, the coach will have to make the decision in the end, as always a team will not be in the same exact position, or against the same team. The idea is to give the coach information to act on.
In order to track effective save rounds, there need to be a couple things in place.
Firstly, how is a save round determined, or marked by the client? With this idea, a good way to mark if a team saved is to simply check a team’s global spending in that specific round. So say if the maximum was 1500$ to be marked a buy round, the whole team would have to spend less than 1500$ to be marked as a save round. Next, we want to determine how a match is considered to be “successful” by the client. While the idea of a save round is to simply “skip” this round and wait for more money, even if the team loses the round it can still be considered a success. For example, if the saving team is able to kill three members of the opposing team, that is 900$ gained on top of the next round base money. While considering this data, it could be useful, but overall, it would be best to say that a successful save round is simply winning the round. Displaying this data to the coach, I need to consider the goal of the game is to win more rounds than the opponent, and not to get more money than them, and displaying the data including extra gains in a round could be potentially misleading.
Next, while displaying this information to the coach I want to make ensure that the coach can easily see which round the game is on, and the statistics of saving for the current round. The statistics of saving the most important information that I am displaying, and is what the coach is going to be making decisions based on. I want the coach to be able to see the number of previous times the team has done a save round on this map, during the specified time range (from the global data filter), the success of the two rounds after the save round, and the average amount of money the team has at the current round. I feel that the coach being aware of these stats will allow them to see previous situations and relate them to the current one. While this will not be able to 100% accurately predict the round outcome, giving the coach the ability to see this kind of information could be very useful, and potentially game winning.
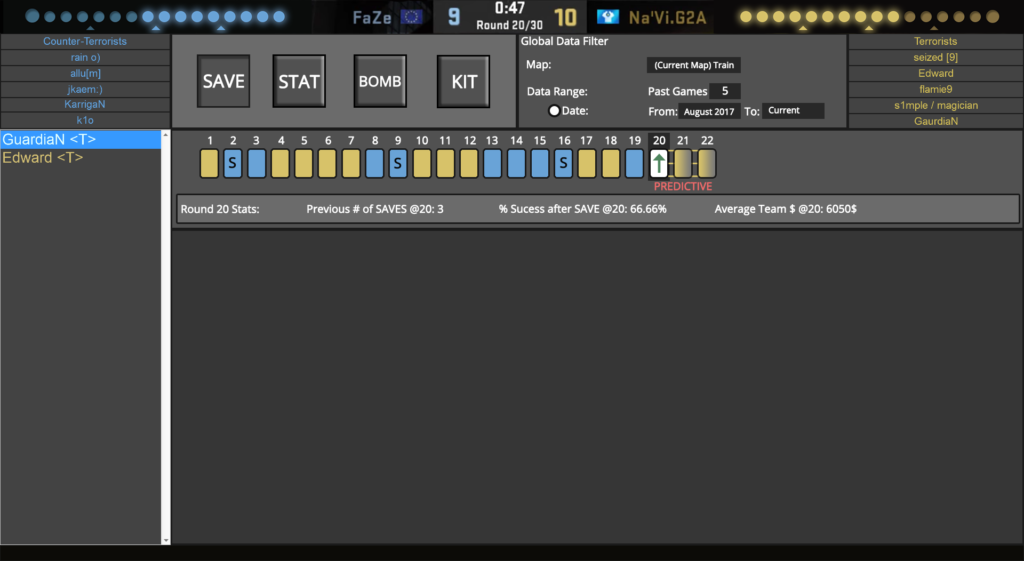
Here is the new mockup, showing the global data filter, and the save statistic feature. First, looking at the global data filter, I want the user to be able to filter all of the data results by the map. Various maps have very different round timings for different sides, so comparing data globally would be very unhelpful. I have also decided to make the data range based on a number of previous games, or on a date range. I have done this because a coach may find it faster to be able to use a month for comparisons because of a meta change, or roster change instead of using previous games. Next, going on to the save statistic data which is pictured below:
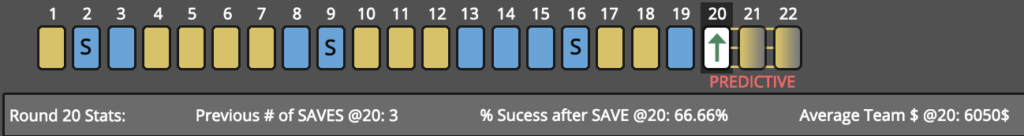
The idea of this screen is to display rounds as they are completed, showing which team won the round using the side color (CT is blue, T is yellow), while also marking which rounds are considered save rounds by the client (marked with an “s”). The round that is currently being played is marked with a dark grey outline, and has an arrow on it, pointed either up or down. The idea of the arrow is that it is the quickest summary of what the team should do considering the past games the team has played, not taking into account the current situation. An arrow pointing up signifies a higher probability of winning the next rounds if the team does a save round. The arrow direction is derived from the stats in the lower window: the number of previous saves in this round, the percentage of success after the save round, and the amount of money the team had on average across the previous games. The two round indicators after the current round indicate if the team will win or lose if the team goes with a save round based on previous data. This is shown by a team color gradient to grey, the team color being the team that is predicted to win the rounds.
Probably the biggest factor the coach will need to take into account before making a decision is the amount of money the team has currently. If the team has so much money that saving would only hinder their current round, then looking at this screen is probably unnecessary. This screen would probably be most used in situations where a couple members of the team can buy out for the team, leaving later matches with less high powered weapons, instead of saving so the better weapons can be bought.
Effective Bomb Plant Locations
This statistic is very straightforward, and the goal here is to present bomb plant locations to the user, showing where bomb detonations have occurred, along with how many people were eliminated with the explosion using size. Giving the user both top down views of each bomb site with using high contrast colors to highlight objects in the area. For marking a bomb plant if the circle is filled, the bomb was detonated, and if the circle is not filled, it was diffused.
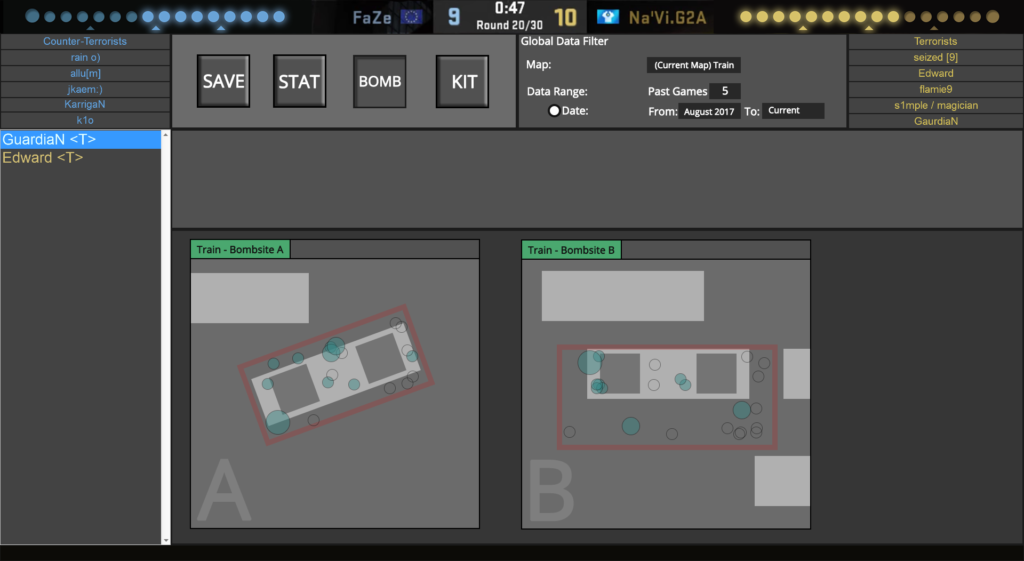
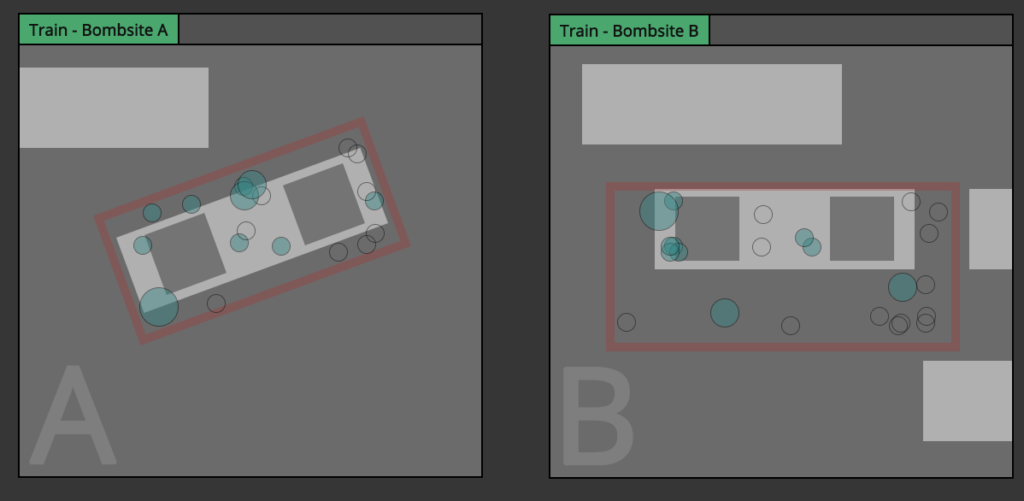
After getting some feedback on this screen, displaying to the user whether or not the team was wiped before the bomb was diffused could be useful information. Given this feedback, adding into the open circle a diagonal line would not obtrusive, but also give useful information to the user that can easily be discounted if necessary.

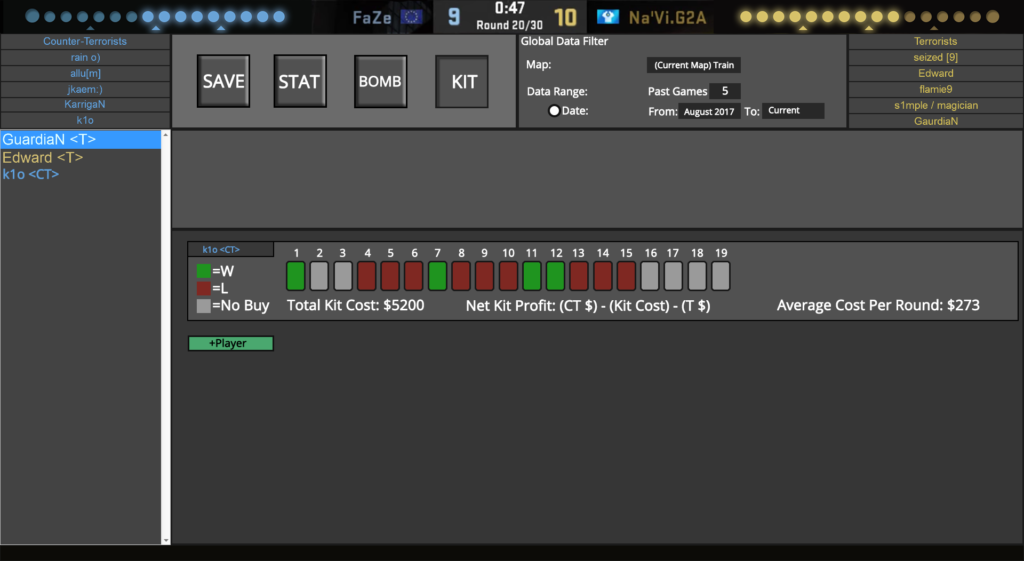
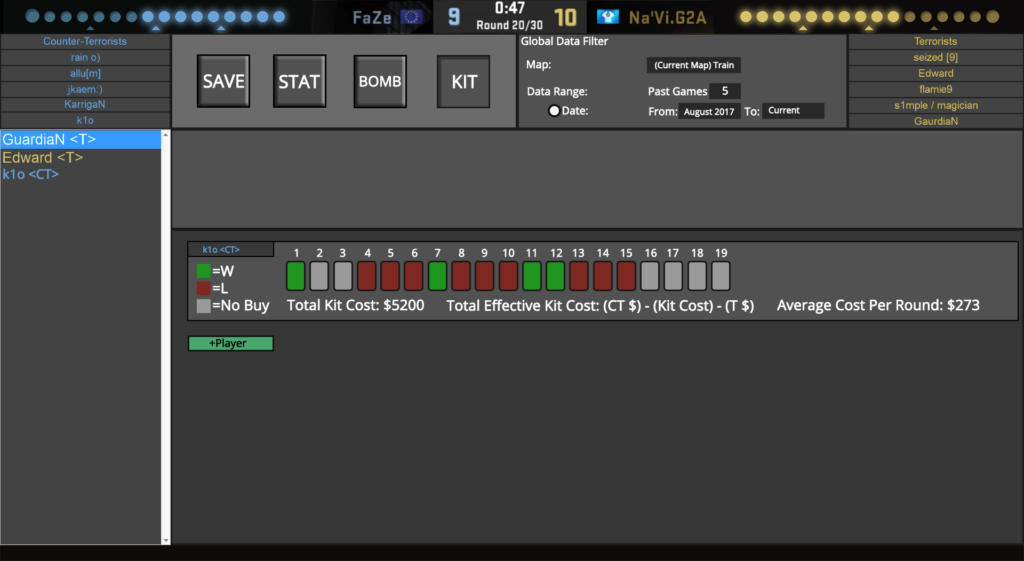
Defuse Kit Stat Dampening
The idea behind this feature is to track whether or not a player who is buying defuse kits has actually been having an impact with them or not. If the defuse kit purchase has not been effective on certain players, the coach can then advise against purchasing them in future for the current game until a major turn occurs. This, in turn, will save the player money to buy better weapons or more gear, potentially turning fights. The feature simply tracks if the defuse kit has been used in a current round, and if it has been the round is marked for the kit being effective. While the player simply using the kit on the bomb, and not defusing it could be marked as ineffective, I feel that the player was still able to get a use out of the kit, and could have been defused later in the round by another player. Pictured below is the mockup I have created for this statistic:
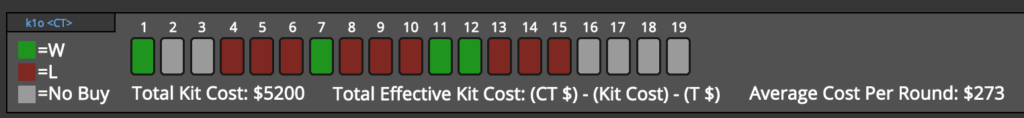
While creating the mockup I came to a few conclusions about the information that I want to display to the user. Firstly, simply marking the round as effective if the kit was used is not useful information because the round could still be a loss. So I decided to have three states of the round for this statistic, Win with diffuse, Lose by detonation (bought kit), and No purchase. Using these three states I feel that it is very easy to see if buying a kit has been useful to the team or not. For the stats listed below the rounds listing the total kit cost, along with the average cost per round is information that is situationally useful. The most important value here, however, is the “Total Effective Kit Cost” value. The goal behind this number is that I want the user to be able to determine if buying a kit has been useful during the current game.
I came up with a formula to try to determine this value: TEKC=(CT$)-(Kit Cost)-(T$). These values to come up with the final number only involve profit from rounds where the bomb was the determining factor of the round. This does not include rounds where a team was eliminated. Taking the winnings from diffusing the bomb in those rounds, then also taking money for losing rounds where the bomb exploded for the CT team gives only the profit for rounds involving the bomb. The idea is to then do the same thing for the terrorist team and subtract that from the CT profits along with the total cost of the diffuse kits. This value should help determine if buying the kits has been worth it overall. Another possible way to do this would be to simply take the diffuse or detonation bonus and add those together, using the same formula to give a less inflated number.
After getting feedback on this screen, it was brought to my attention that displaying effective kit cost as a negative value in its current state shows a gain. While this is ok, I feel like changing the wording on this stat to reverse the effect to make it easier to read. I have since changed this stat to be “Net Kit Profit”.